
Page 38 - ⑨环境与发展第6期
P. 38
0.36, respectively, which were all low correlation; The correlation coefficients of ammonia nitrogen and permanganate ߌაؿᅚ࿐ඌ௹़
环境与发展 ߌაؿᅚ࿐ඌ௹़
HUANJINGJIANCE 环境监测
ߌაؿᅚ࿐ඌ௹़
lower than the V-Class standard. Except for 2018, the annual average concentration had increased significantly, and
the change in other years was not obvious. The serious pollution of total nitrogen had not changed obviously. (2) The to⁃
tal nitrogen pollution in Shanmei reservoir was serious in the high water period. (March to September). (3) The correla⁃
tion coefficients of total nitrogen monthly mean concentration and dissolved oxygen, five day biochemical oxygen de⁃
mand, chemical oxygen demand, fecal coliform group, pH, water temperature and transparency were lower than 0.3, ߌაؿᅚ࿐ඌ௹़
which was not related; The correlation coefficients of fluoride, chlorophyll a and total phosphorus were 0.48, 0.39 and
index were 0.56 and 0.51, respectively, which were all moderately correlated.
Key words:Shanmei Reservoir; total nitrogen; pollution characteristics; correlation analysis; eutrophication
ߌაؿᅚ࿐ඌ௹़
近年来,随着社会经济的发展和人口的激 年度监测结果、月度监测结果、进出口浓度差
增,我国水体富营养化问题十分突出,其主要原 异进行分析,并将总氮月均监测结果与溶解氧、
因是由于水体中营养盐的含量不断增高 [1-2] 。水 氨氮、BOD 等监测指标进行相关分析,以期为
库是人们重要的生活饮用水水源之一,由于人 该水库的总氮污染防治提供一定的参考。
类活动输入生物所需的大量N、P等营养物质, 1 材料和方法
导致了水库的富营养化,富营养化改变了水体 1.1 点位设置
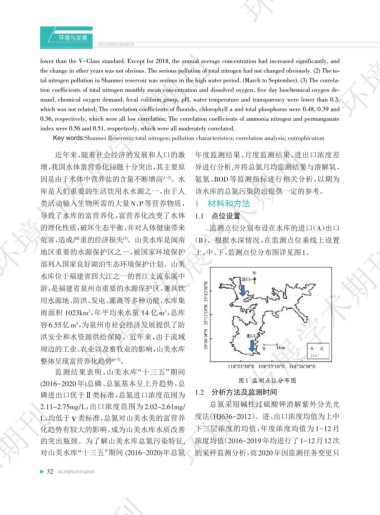
的理化性质,破坏生态平衡,并对人体健康带来 监测点位分别布设在水库的进口(A)出口
危害,造成严重的经济损失 。山美水库是闽南 (B)。根据水深情况,在监测点位垂线上设置
[3]
地区重要的水源保护区之一,被国家环境保护 上、中、下,监测点位分布图详见图1。
部列入国家良好湖泊生态环境保护计划。山美
水库位于福建省四大江之一的晋江支流东溪中
游,是福建省泉州市重要的水源保护区,兼具饮
用水源地、防洪、发电、灌溉等多种功能,水库集
ߌაؿᅚ࿐ඌ௹़
雨面积 1023km ,年平均来水量 14 亿 m³,总库
2
容6.55亿m³,为泉州市社会经济发展提供了防
洪安全和水资源供给保障。近年来,由于流域
周边的工业、农业以及畜牧业的影响,山美水库 ߌაؿᅚ࿐ඌ௹़
整体呈现富营养化趋势 [4-7] 。
监测结果表明,山美水库“十三五”期间
(2016-2020 年)总磷、总氮基本呈上升趋势,总 图1 监测点位分布图
磷进出口优于Ⅱ类标准,总氮进口浓度范围为 1.2 分析方法及监测时间
ߌაؿᅚ࿐ඌ௹़
总氮采用碱性过硫酸钾消解紫外分光光
2.11~2.75mg/L,出口浓度范围为 2.02~2.61mg/
L,均低于ⅴ类标准,总氮对山美水美的富营养 度法(HJ636-2012)。进、出口浓度均值为上中
化趋势有较大的影响,成为山美水库水质改善 下三层浓度的均值,年度浓度均值为 1-12 月
的突出瓶颈。为了解山美水库总氮污染特征, 浓度均值(2016-2019年均进行了1-12月12次
对山美水库“十三五”期间 (2016-2020)年总氮 的采样监测分析,而2020年因监测任务变更只
32 HUANJINGYUFAZHAN
ߌაؿᅚ࿐ඌ௹़